All too often of late, I have seen people having trouble trying to debug some JavaScript or other.
Some were stumped by the white screen of death which confronted them the minute their script failed silently, whilst others were trying to debug their program using an alert dialogue box (a truly tedious process).
Well, good news it at hand. There is another, more efficient way to do things – with the console.
The console is part of the development tools which are (to some extent) integrated into all of the modern browsers.
In this short tutorial I am going to focus on using Chrome’s Dev Tools, but there’s no reason you couldn’t follow along using Safari’s WebKit Inspector, Firebug for Firefox, Internet Explorer’s Developer Tools or Opera’s Dragonfly.
So, assuming you’re in Chrome, open up a web page and hit the F12 key. You should see a panel open up at the bottom of your screen, like so:

Then, just click on the Console tab on the far right.
So, I’m in the Console. What now?
Let’s start off by outputting something. You can do this with the command: console.log()
Here’s an example. Copy the following code to your PC and save it as an HTML file.
<!DOCTYPE HTML>
<html>
  <head>
    <meta charset="UTF-8">
    <title>Hello, World!</title>
  </head>

  <body>
    <h1>The output!</h1>

    <script>
      console.log("Hello, World");
    </script>
  </body>
</html>
When you open the page in your browser (ensuring that the console is also open), you should see something similar to this:
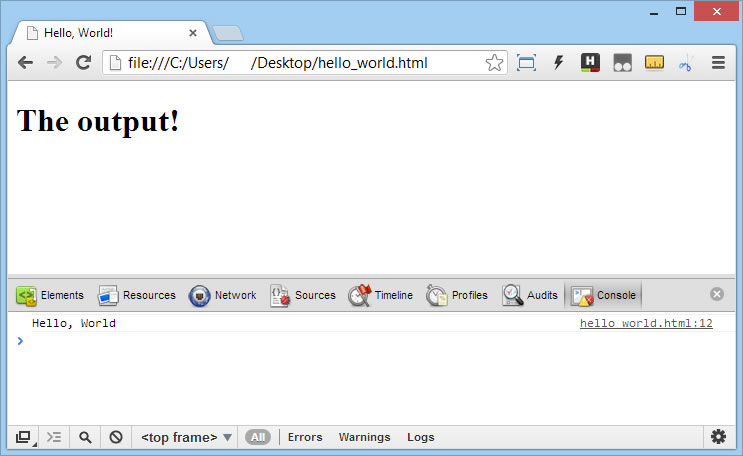
Neat, huh?
A Real World Example
Now let’s look at how we might use this to solve a real world problem. Imagine we have the following HTML and JavaScript:
<!DOCTYPE HTML>
<html>
  <head>
    <meta charset="UTF-8">
    <title>Simple addition</title>
  </head>

  <body>
    <p>Two times two is: <span id="result"></span><p>

    <script>
      document.getElementById("res").innerHTML(2*2);
    </script>
  </body>
</html>
At first glance everything looks great. We run our file, eagerly expecting the result of the calculation to be written to the screen, and see … nothing!
So what went wrong?
Well, a quick look at the console shows us that we have a problem on line twelve of our script:
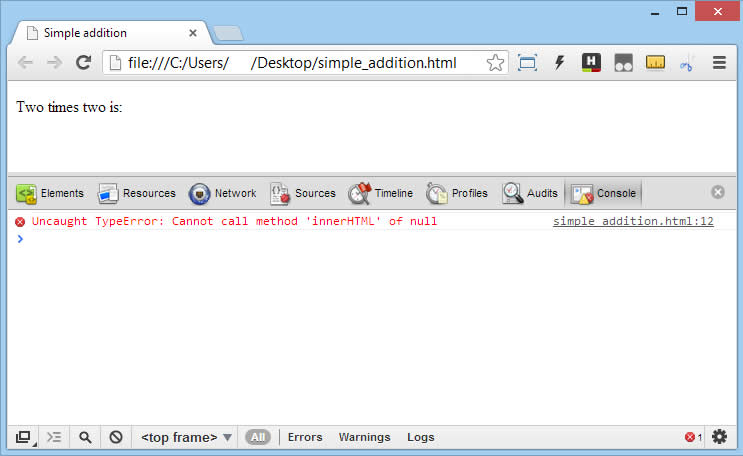
To be precise, it seems that document.getElementById("res") is returning null, which is of course correct, as the id of the span which we are trying to target is result, not res.
So let’s correct that and refresh the page.
Hmm, another error. Now we’re seeing this:
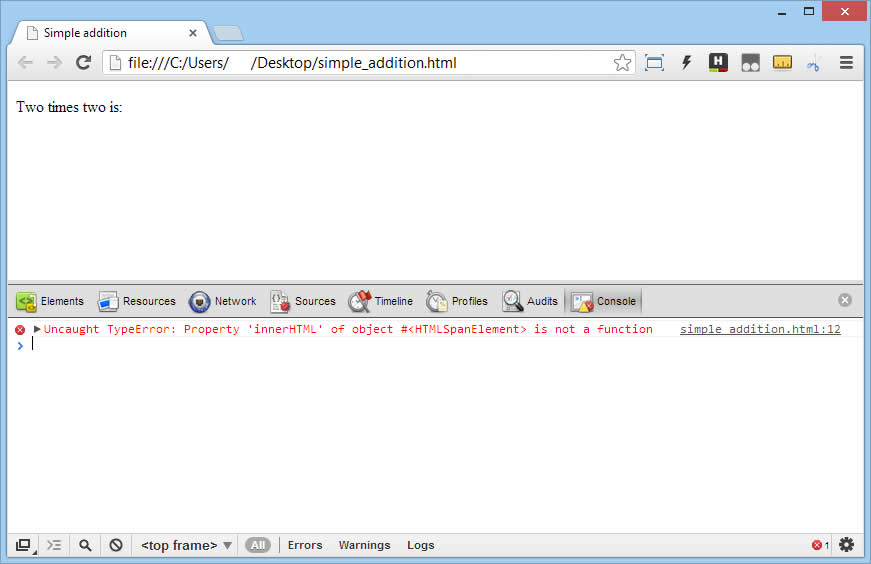
This error message is a bit more cryptic, but it points us to the line where the error occurred. Something seems to be going on with the innerHTML method.
A quick look at the documentation tells us that the correct syntax is HTMLElementObject.innerHTML=text.
Oops, too much jQuery!
Once we have corrected this error (removing the brackets and replacing them with an equals sign) and refreshed the page, everything works as expected.
So What’s Wrong with Using alert() to Debug Stuff?
Well, in a nutshell alert() needs to be dismissed before JavaScript execution can resume. Consider the following where we want to sum all of the elements of an array:
var arr = [0, 1, 2, 3, 4, 5, 6, 7, 8, 9];
var t = 0;
for(var i= 0; i < arr.length; i++){
 alert(t);
 t += arr[i];
}
In this example, alert() will fire ten times and will need to be clicked away ten times.
By the tenth time, you will also have forgotten what the first value actually was (although admittedly not in this simple example).
If you replace the alert(t) with console.log(t), then you will save yourself ten clicks and you will have a nice overview of the output.
Some more reasons to prefer console.log() are:
- It formats your objects nicely and allows you to traverse them.
- Logging statements often have an interactive pointers to the code which issued them.
- It allows you to deeply examine objects, rather then just seeing the results of calling
toString()on them. - If forgotten, the end user will not get to see any logging statements.
In Defence of alert()
I added this section on 20.02.2013, after Stephen Chapman (R.I.P.) pointed out a small saving grace of using alert().
This is namely, that Chrome, Safari and Firefox will display a checkbox on the second and subsequent times the alert appears, whereas Opera will display an extra checkbox which allows you to turn off JavaScript on the page.
This means that if you figure out the problem on the first or second alert you can skip the rest.
Conclusion
We’ve only just scratched the surface of using the console to debug code. It is a very powerful too and can do so much more that I have demonstrated here.
I urge you to take the time and read one of the Nettuts+ tutorials I link to in the references, you will amaze yourself at how much more productive you can become with comparatively little effort.
This post currently has 1 response
Pingbacks:
Comments are closed!